Customising the Grade Centre to view student progress at a glance
When you have a mix of assessments, such as Turnitin, alongside Blackboard Assignment, Blogs, Journals or discussion, marks are displayed in separate columns in the Grade Centre. If you use mostly Turnitin, then the new analytics dashboard in Turnitin will be a good source of information.
There are also a number of practical things you might want to consider to prepare the Grade Centre for a smoother turnaround when marking arrives, two of which are colour-coding and smart views. This may seem like additional work, but like rubrics, and marking schemes they may prove their worth when you come to marking.
A couple of easy moves for views of student progress:
1: Consider Colour-coding
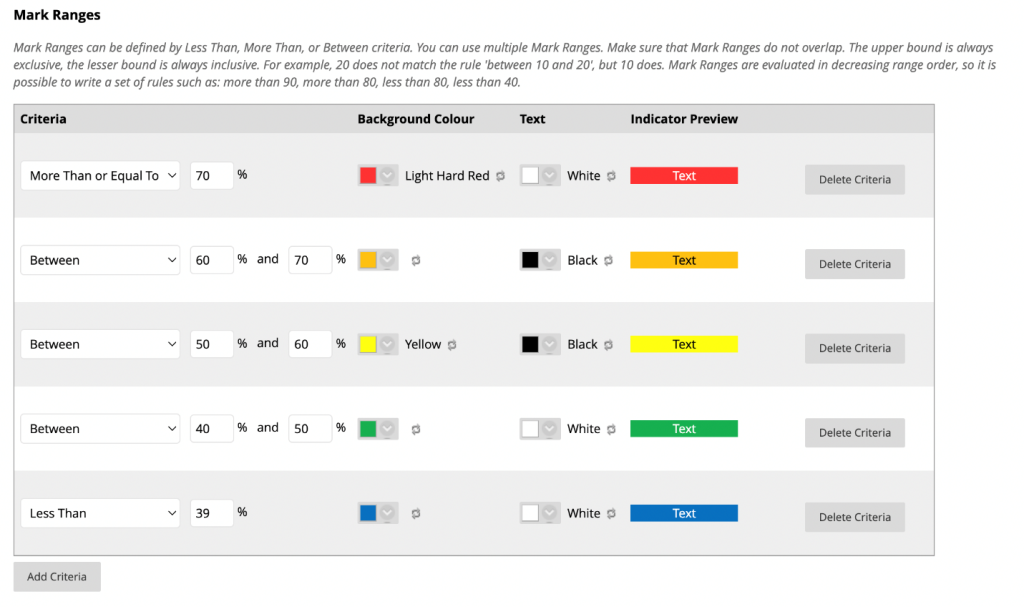
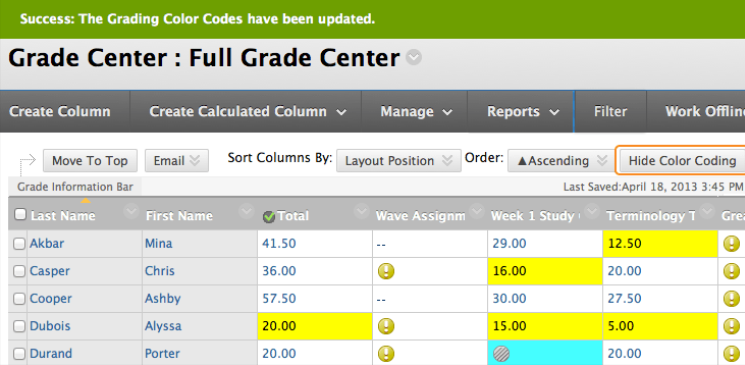
Colour gives you an instant visual overview of class progress. This may be particularly useful where there are several markers or when the cohort of students is relatively large. While the below dashboard shows how to highlight different levels (or bands of marks), it’s also possible to highlight marking progress. For example, you can highlight all marks over 70%, or under a certain threshold.
Colour-coding should only take a few moments to do. Click the link to this video to show you how.

Click on the ‘Hide Colour Coding’ button to toggle the colours off and on again.

2: Using Smart Views
Smart Views allow you to pull out detail for specific groups or by category, such as performance level
If you have groups set up for your class, say for example, different seminars, this will enable markers to pull out marks for that group. [In detail]
Video How to create Smart Views
Downloading Grade Centre
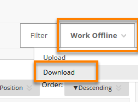
Finally, you can download the entire Grade Centre to work offline and perform further interrogation of the data in Excel.

Reminder:
Grade Centre is visible only to staff. Students see only their own marks and feedback via My Marks (Turnitin links for Turnitin).
- Full details of all of GradeCentre options can be found at this link
- Access a column header’s menu (down arrow at top) and select Column Statistics:
- To display average, median and standard deviation
- Select Submission Receipts to view who submitted and when
- Select Mark History to view who marked and feedback inserted via Grade Centre
- To apply weightings to columns, there is also a nice little video quick guide at this link.
