

The viewing statistics in DMU Replay can offer potentially valuable insight into the ways your students are engaging with your recorded content.
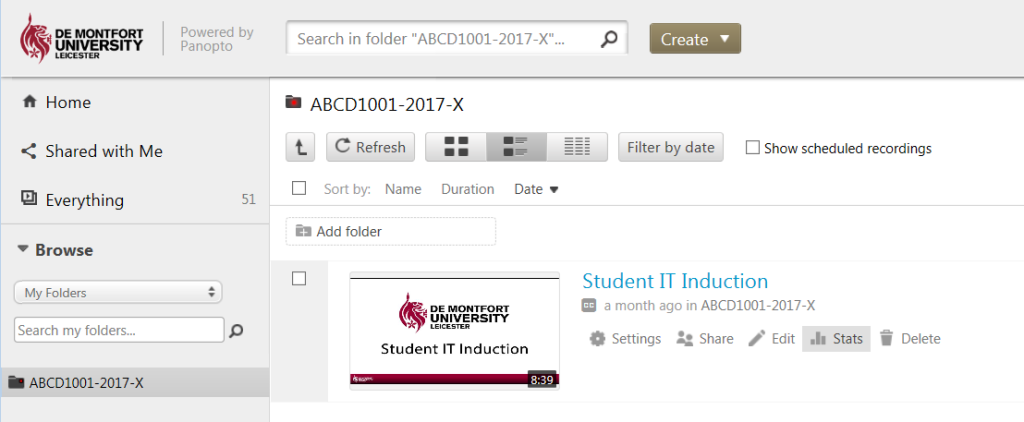
Viewing statistics for an individual recording can be accessed via the Stats tab.
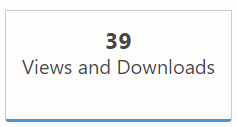
There are some headline stats such as:
Total number of views (this includes individual students who have viewed multiple times).
Total number of viewers (how many individual students have viewed some or all of the content)
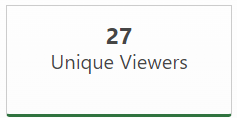
This unique viewer stat can be useful in determining the level of overall engagement with the recording. E.g. if you have a cohort of 80 students and a recording has been viewed by 20 – you may want to investigate why students are not engaging with the recording.
Panel 1 – Views by day
The viewing by day can be a useful graph for unpacking certain viewing behaviours. The blue column indicates the total number of views; the green column, the total number of unique views – on a specific day. The yellow line is the total number of minutes that the recording was viewed for on that day.
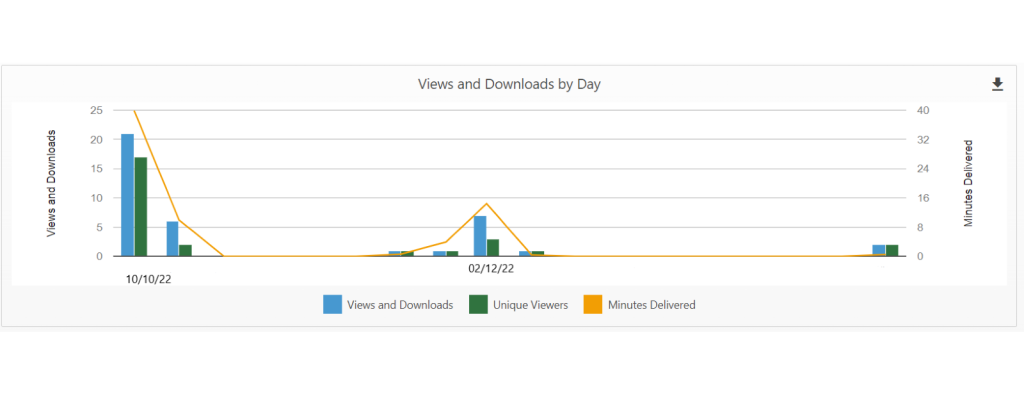
In this example we can see a peak in views in October – perhaps when the recording was first released. There is a second peak in views in December – were this to be shortly before an assessment it may indicate that students are revisiting this recording to revise for their assessment (a good sign perhaps!). If you were to compare the peak in viewing of this recording with other recordings that contained content pertinent to the upcoming assessment – and found that students were not revisiting other recordings at the same level; it could indicate that students were unsure about some particular aspect of their learning that you covered in this session.
Panel 2 – Viewer engagement
The viewer engagement panel displays the total number of views (on the left y-axis) in relation to the duration of the recording (x-axis). In this example the recording duration is four (4) minutes.
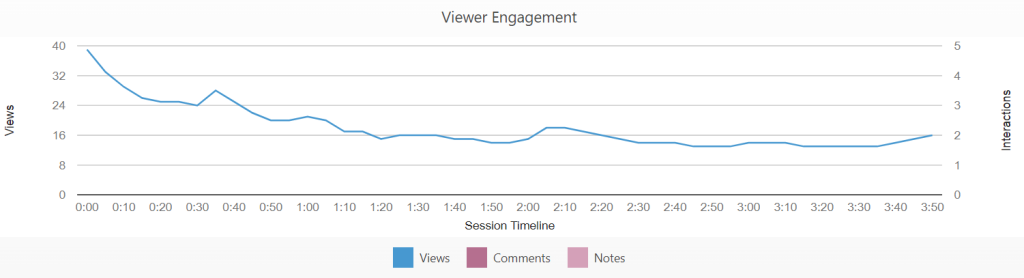
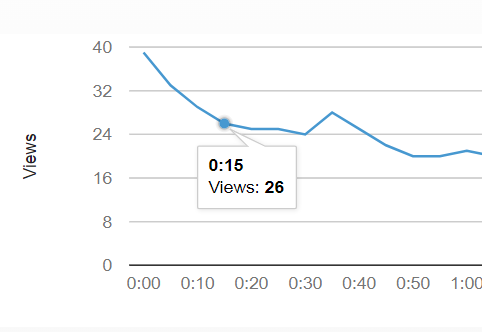
Hovering your cursor over a point on the blue line indicates the total number of views for that particular point in the recording. E.g. there have been 26 views of the recording at 15 seconds.
We can use this graph to determine what particular parts of the recording are getting the most views. For example, we can see a peak in the number of views at thirty-five (35) seconds and another smaller peak at around two (2) minutes.
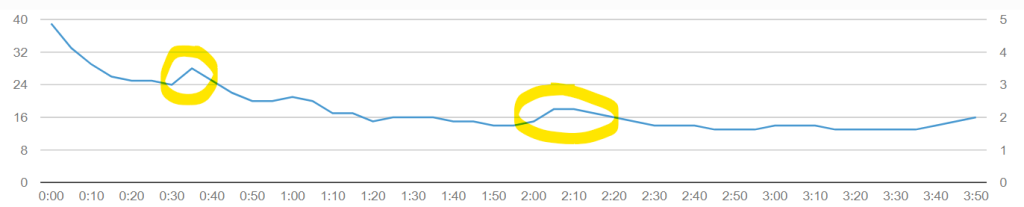
Students may be re-visiting these particular parts of the recording for several reasons. These viewing peaks may correspond to sections in which you are explaining certain topics/concepts/aspects of required knowledge or understanding that some students are struggling to understand. This could be in the lead up to assessment – for revision purposes – and students are focussing in on aspects of knowledge and understanding that they don’t feel particularly strong on. It could also indicate a more general lack of understanding in certain areas of their learning. Knowing this information presents an opportunity for you to revisit these areas of misunderstanding in subsequent sessions. This can be particularly pertinent if the areas of misunderstanding are threshold concepts of which the students need to have a good understanding – as they are foundational concepts upon which they build a deeper understanding.
Panel 3 – Individual viewing stats
We can also explore the viewing stats for individual students. To access a student’s viewing stats – click their name in the Top Viewers panel.
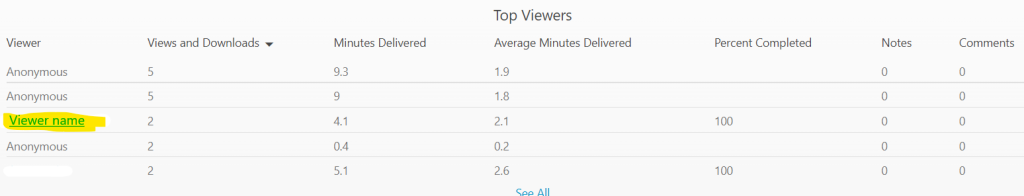
This will launch a panel which displays all of the student’s viewing stats for all sessions (not just the specific session recording that you were looking at).
This stats view can be used to identify students who have not been revisiting and viewing recordings – this can be particularly useful when combined with other student engagement data. E.g. a student has been identified as underperforming on assessments. Checking their DMU Replay viewing habits may reveal a lack of engagement with the recordings. This information could then be communicated to the student’s personal tutor who may then encourage the student to more actively engage with the DMU Replay recordings.
The Digital Learning and Teaching Team offer a staff development session titled Enhancing your DMU Replay Recordings which includes information about how to view DMU Replay statistics. This session can be booked via the DMU Hub.
Contact your Digital Learning and Teaching Consultant if you would like to explore in more pedagogic detail the ways in which you might effectively use this approach for teaching, learning and assessment.