
The new Learning Analytics Dashboard in Turnitin can help provide a useful indication into how your students have engaged with a Turnitin assignment. By further examining the Analytics of a Turnitin assignment, you can use the tool to determine where you may need to explore content further with students to aid their learning development.
You can access the Analytics from the menu bar within your Turnitin assignment inbox – just click the ‘Analytics’ tab on the top of the screen. From within the Analytics tab, you have several menu ‘tools’ available:
- Submissions Timeline
- Similarity Score
- Average Source Variety
- Submissions
- Feedback
- Online Grading Report
Let’s unpack three of these tools in more detail and where you might use them to enhance your practice.
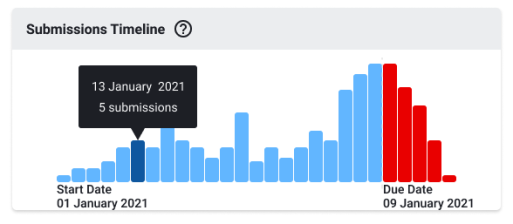
Submissions Timeline
This timeline provides an insight into the submission dates of the assignment, providing a visual representation over time. Each day of submission a bar is shown on the chart. This provides an understanding of when students are engaging with their assignments and submitting their work. This is especially useful for draft submissions, if enabled in the assignment settings. You can use the Submissions Timeline to determine when students are engaging with draft submission for their assignment.
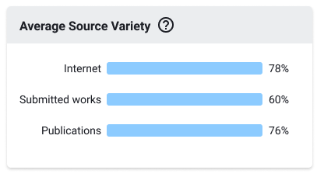
Average Source Variety
The Average Source Variety tool provides a visual representation and breakdown of the type of average similarity found across all submissions within a Turnitin assignment. This is a great birds-eye view of the types of sources students are using for a particular assignment. You may wish to view this to analyse if students are using a good amount of publication sources in the assignment by checking if Publications exceeds Internet and Submitted works, for example, which is particularly useful for literature review type assessments. You may also wish to track this across academic years and levels to ensure your cohort is developing their use of sources from internet to publications.
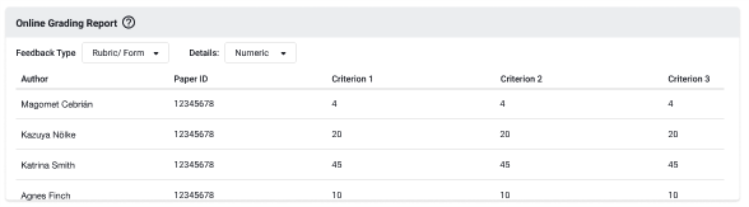
Online Grading Report
The Online Grading Report provides a range of statistical data related to the use of marking features used with marking student assignments. These include QuickMarks, Rubric/Grading Forms and Grammar Marks. The report provides a useful breakdown of the number of instances when grading marks have been used when you have marked student work.
This is particularly useful, for example, when sharing QuickMark sets with other markers or using a shared Rubric or Grading Form, whereby you can identity if a certain QuickMark comment (e.g. about referencing, or a poor introduction) has had significant use when marking, which can help identity learning development needs for students on a module or course.